
Contemplating Deaths from Car Accidents : The dissemination of information About Deaths and the Viewer's Perspective on Installation Art through Generative Real-time Data Visualization Displays
DOI:
https://doi.org/10.69598/decorativeartsjournal.1.79-114Keywords:
Database Art, Installation Art, Real-time Generative Art, Tragedy in Art, Contemporary Art, Technology-based ArtAbstract
Diagrams have been used to display information for a variety of reasons since prehistoric times. Later, economic, scientific, geographical, and statistical diagrams were utilized. As computer technology progressed, the resulting diagram got increasingly complex and accurate. Stephen Wolfram, a British mathematician, utilized computer technology to produce a diagram depicting his daily behavior, which included sending e-mails and the number of keystrokes on the keyboard. Hsieh Teh Ching also utilized this notion in his "One Year Performance" series. He reflects capitalism by photographing himself over the course of a year and clocking himself with a punch card. Both works demonstrate how statistics, data, and graphs may be used to convey a message through the medium of art.
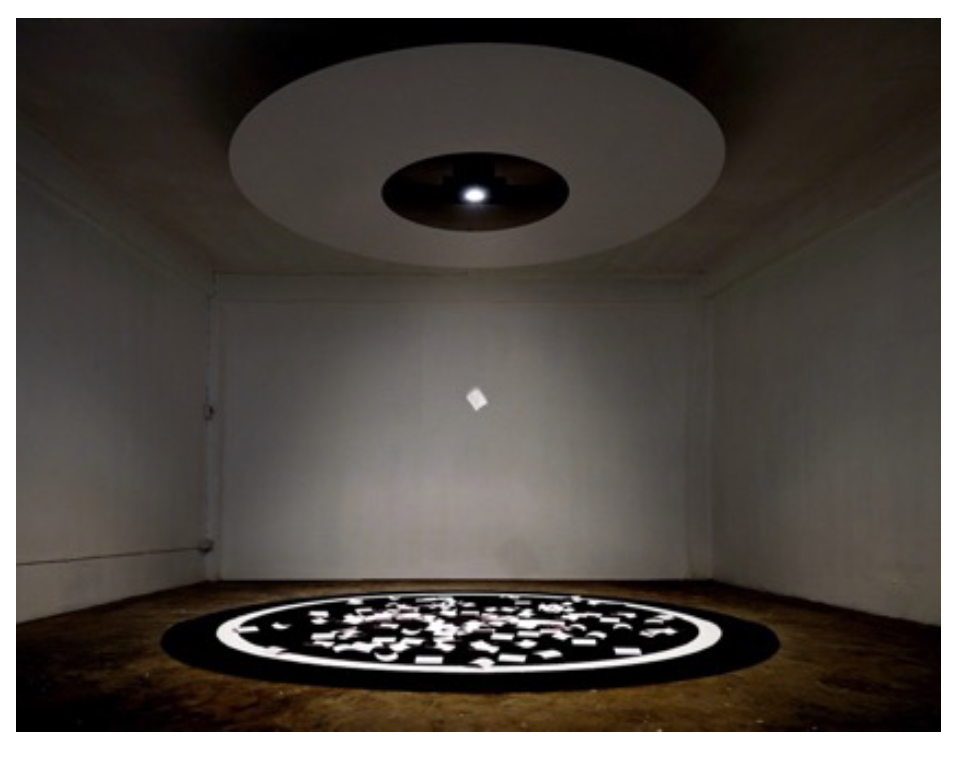
The author's work is an additional instance of data and information being used to convey and send messages through art. By tying the receipt printing technology to the website's accident database, the statistics of fatal car accidents were used to generate artworks that were automatically created in real-time, associating consumerism with the valuable value of life. When death notices are posted online, the printer will print a receipt and let it fall from the ceiling like a leaf, symbolizing a life that will never return.
This artwork is intended to collide with audience expectations and the experience of seeing art, in addition to providing the optimal environment for computer processing to develop autonomously art installations. On the other side, the phenomena of happiness that this activity generates is life and death of fellow creatures.
References
กุลยา กาศสกุล. (2564, 5 เมษายน). พลิก : Flip เมื่อการชมนิทรรศการทำให้เกิดการมองเห็นและรับรู้ในหลายแง่มุม
ทั้งลึกและกว้าง. FYI Bangkok. https://www.fyibangkok.com/flip/
ฐานเศรษฐกิจ. (2021). อุบัติเหตุทำไทยสูญ 5 แสนล้าน. หนังสือพิมพ์ฐานเศรษฐกิจ. https://www.thansettakij.com/money_market/475303
ART+COM Studios. (2008). Kinetic sculpture - the shapes of things to come. https://artcom.de/en/?project=kinetic-sculpture
Chrisman, N. (2006). Charting the unknown. How computer mapping at Harvard became GIS. ESRI.
Copland, E. (2019, April 29). An art and a science: Artists use data from the Global Terrorism Database (GTD) in works of data visualization art. https://www.start.umd.edu/news/art-and-science-artists-use-data-global-terrorism-database-gtd-works-data-visualization-art
Heathfield A., & Hsieh T. (2008). Out of now: The lifeworks of Teh Ching Hsieh. The MIT Press.
Infogram. (2016, June 16). Key figures in the history of Data Visualization. Medium.
https://medium.com/@Infogram/key-figures-in-the-history-of-data-visualization-30486681844c
Playfair, W. (1801). The commercial and political atlas and statistical breviary (Third Edition). Burton.
Selin, H. (2019). Encyclopaedia of the history of Science, Technology, and Medicine in Non-Western Cultures. Springer.
Sridharan, M. (2021, September 22). Data Visualization: History and origins. Think Insights.
https://thinkinsights.net/digital/data-visualization-history/
teamLab. (2018). Flutter of butterflies beyond borders, ephemeral life born from people. https://www.teamlab.art/th/w/butterflies_ephemerallife_people/
The British Museum. (2008). Tablet. https://www.britishmuseum.org/collection/object/W_1882-0714-509
Vemund, H. (2012). The Personal Analytics of my life. Stephen Wolfram Writings RSS. https://writings.stephenwolfram.com/2012/03/the-personal-analytics-of-my-life/
Downloads
Published
How to Cite
Issue
Section
Categories
License
Copyright (c) 2022 DEC Journal

This work is licensed under a Creative Commons Attribution-NonCommercial-NoDerivatives 4.0 International License.
Published by Academic Affairs Division, Faculty of Decorative Arts, Silpakorn University. The copyright of the article belongs to the article owner. Published articles represent the views of the authors. The editorial board does not necessarily agree with and is not responsible for the content of such articles.

